

U.S. presidential elections have a significant impact on financial markets. Historical analysis reveals that market volatility tends to increase in the months leading up to elections due to uncertainty about potential policy changes. However, this volatility often subsides after the election, and markets typically experience a boost in returns during the initial year of a new presidency. This positive trend is driven by anticipation of new economic policies and a reduction in political uncertainty.
- Pre-Election Fluctuations: The months leading up to U.S. elections often experience increased market volatility as investors react to uncertainty about potential policy changes.
- Post-Election Stability: Following the election, market volatility tends to decrease as uncertainty is reduced.
- Positive Returns: Historically, the period immediately following U.S. elections has seen higher average returns compared to the pre-election period, suggesting that reduced uncertainty can lead to improved market performance.
In the 1984 U.S. presidential election, Ronald Reagan achieved a remarkable landslide victory by winning 49 out of 50 states. His “Morning in America” campaign, brimming with optimism and promises of economic renewal, not only captured the hearts of voters but also positively influenced the Russell 1000 index. The three months following the election are still celebrated as one of the most robust post-election market performances in the nation’s history.
American presidential elections are significant events that extend far beyond the political arena; they have profound impacts on global financial markets. With more than 60% of the FTSE All-World Index composed of U.S. equities and the U.S. dollar holding its position as the world’s leading reserve currency, the outcome of these elections influences investment flows, international trade, and economic policies on a global scale. Investors around the world closely monitor the period leading up to each election, as expected political shifts can trigger market volatility and sway investor sentiment. But what unfolds after the votes are tallied?
In this article, we will delve into the key market trends in volatility and returns surrounding U.S. presidential elections, highlighting how the uncertainty inherent in these events impacts financial markets. We will also discuss historical patterns observed under different presidential administrations, though it’s important to note that these averages are influenced by a multitude of factors such as monetary policy and global events.
As the U.S. election season intensifies, markets typically brace for increased uncertainty. Historically, periods leading up to elections have been marked by heightened volatility as investors react to the unpredictability of the outcomes. The anticipation of potential shifts in policy and economic direction fosters increased market fluctuations. However, this turbulence usually begins to subside once election results are announced and a clearer picture emerges.
To illustrate this, Exhibit 1 presents the average changes in the CBOE Russell 2000 Volatility Index (RVX)—which estimates the expected 30-day volatility of the Russell 2000—during the last three U.S. elections in 2012, 2016, and 2020. In the ninety days preceding these elections, the RVX averaged about 23.8. In contrast, during the first ninety days following the elections, it averaged around 22.5. A closer examination of each period reveals a consistent pattern of volatility surrounding each election.

Source: FTSE Russell/LSEG, data as of August 31, 2024. Past performance is not a guarantee of future results.
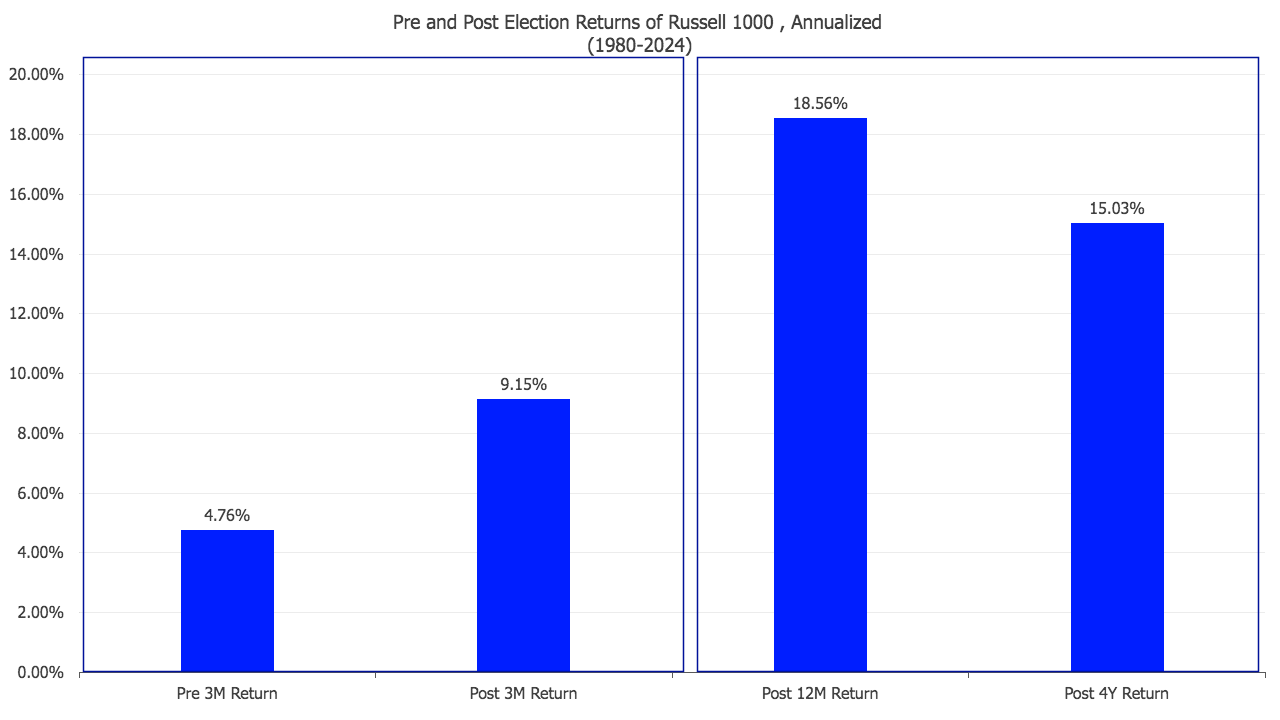
The increased volatility seen in the period leading up to elections often correlates with lower returns compared to those after the election. In contrast, the post-election phase typically ushers in a sense of relief and a rejuvenation of investor confidence. This is especially true for U.S. large-cap stocks, which often experience a significant upward movement. Examining historical data from the last 11 election cycles since 1980 reveals a noteworthy trend in the performance of the Russell 1000 Index. On average, the three months before an election deliver returns of approximately 1.2% (equating to an annualized rate of 4.76%), as depicted in Exhibit 3. However, in the three months following an election, returns nearly double, averaging 2.3% (or 9.15% annualized). Interestingly, only three out of these eleven elections saw negative returns in the post-election period (refer to Exhibit 2). These exceptions notably occurred during periods of significant economic downturn, such as the Dot-Com Recession in 2000 and the Great Recession in 2008.
Exhibit 2: Post-Election Trends in Russell 1000 Index Returns
Source: Data from FTSE Russell/LSEG as of August 31, 2024. Past performance does not guarantee future results.
Historically, the initial year of a new presidential term has often been marked by stronger-than-average returns, setting it apart within the standard four-year presidential cycle (see Exhibit 3). This pattern is chiefly due to a decrease in political uncertainty following an election, coupled with market optimism about prospective new policies and their potential economic impact. Forward-thinking investors typically respond favorably to the anticipation of fresh fiscal initiatives, whether they involve tax reforms, infrastructure spending, or the relaxation of financial regulations. Such policies are generally viewed as catalysts for growth, which boosts market confidence. As the turbulence associated with election volatility diminishes, markets usually transition into a more stable phase and tend to favor U.S. equities. It is important to note, however, that the first year of a presidency is not without its difficulties, as the shift from campaign rhetoric to the implementation of actual policies can introduce new risks.
Exhibit 3: Average Annualized Total Returns of the Russell 1000 Before and After Elections (1980–2024)
Source: FTSE Russell/LSEG; data as of August 31, 2024. Past performance is not indicative of future results.
On average, financial markets and macroeconomic indicators have exhibited significant differences depending on which political party holds the presidency. However, it’s important to recognize that market returns are also heavily influenced by factors independent of presidential elections, such as monetary policies and the structure of industries.
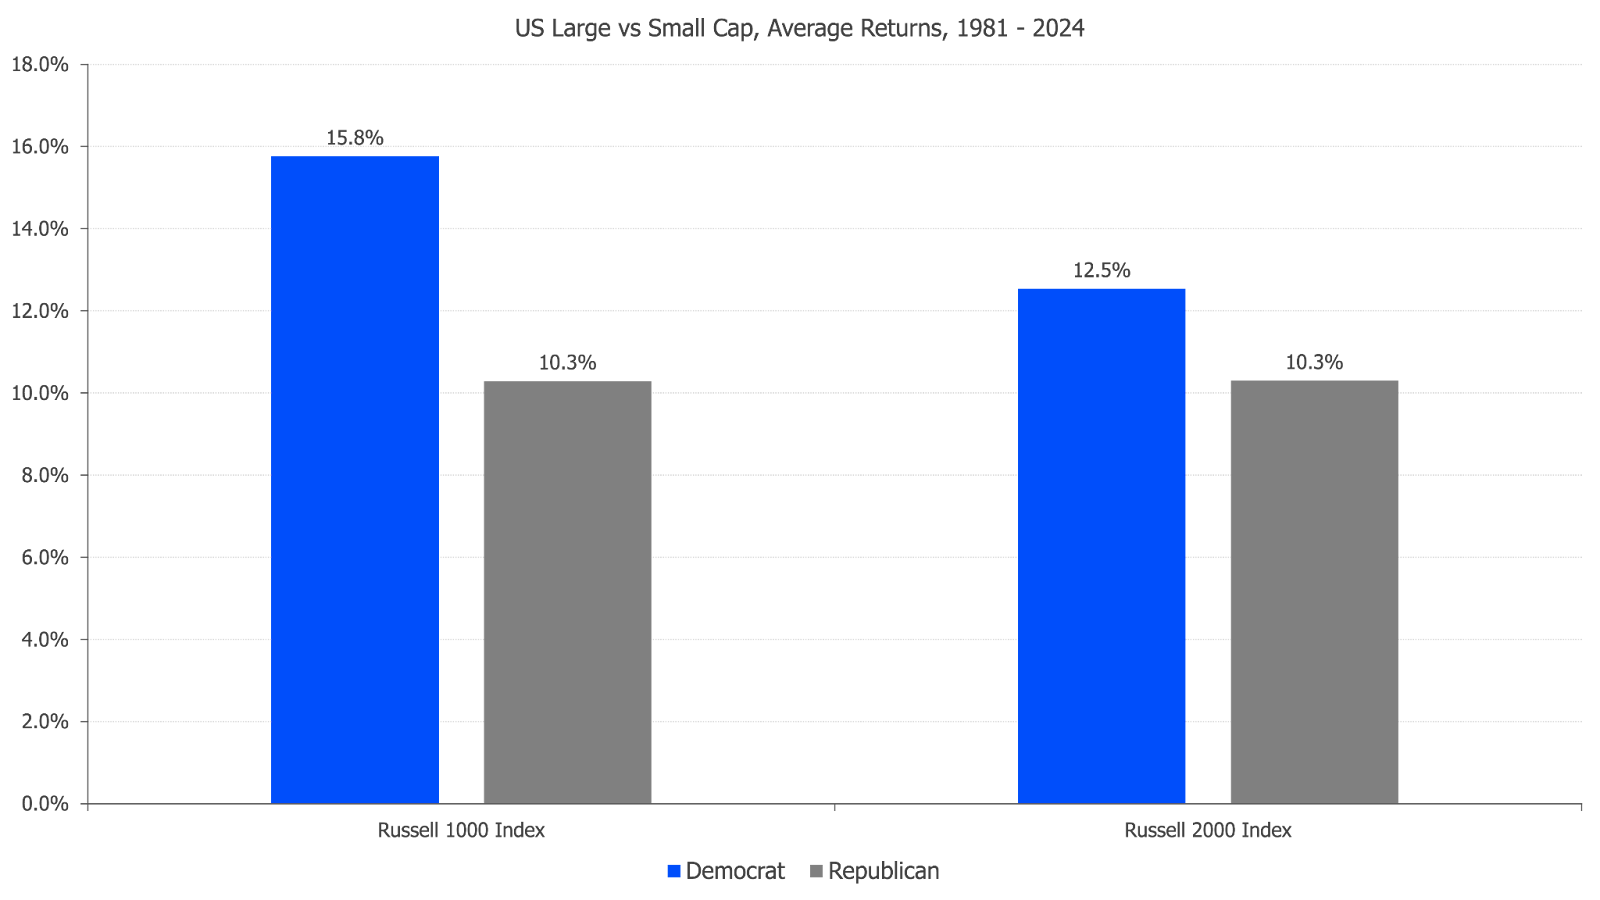
Since 1981, U.S. large-cap stocks have generally outperformed small-cap stocks (see Exhibit 4). This outperformance can be attributed to inherent characteristics of large-cap companies: diverse revenue streams, stronger balance sheets, and greater access to global markets. With the gradual consolidation across most industries over recent decades, these qualities have become increasingly important. These factors enable large-cap firms to consistently perform well, regardless of the political environment. While both large- and small-cap equities have achieved positive returns under different presidential terms, the outperformance of large-cap equities over small caps has been more pronounced during Democratic administrations.
Exhibit 4: Average Total Returns of U.S. Large-Cap vs. Small-Cap Stocks, 1981–2024
Source: FTSE Russell/LSEG; information as of August 31, 2024. Please remember that past performance is not indicative of future results.
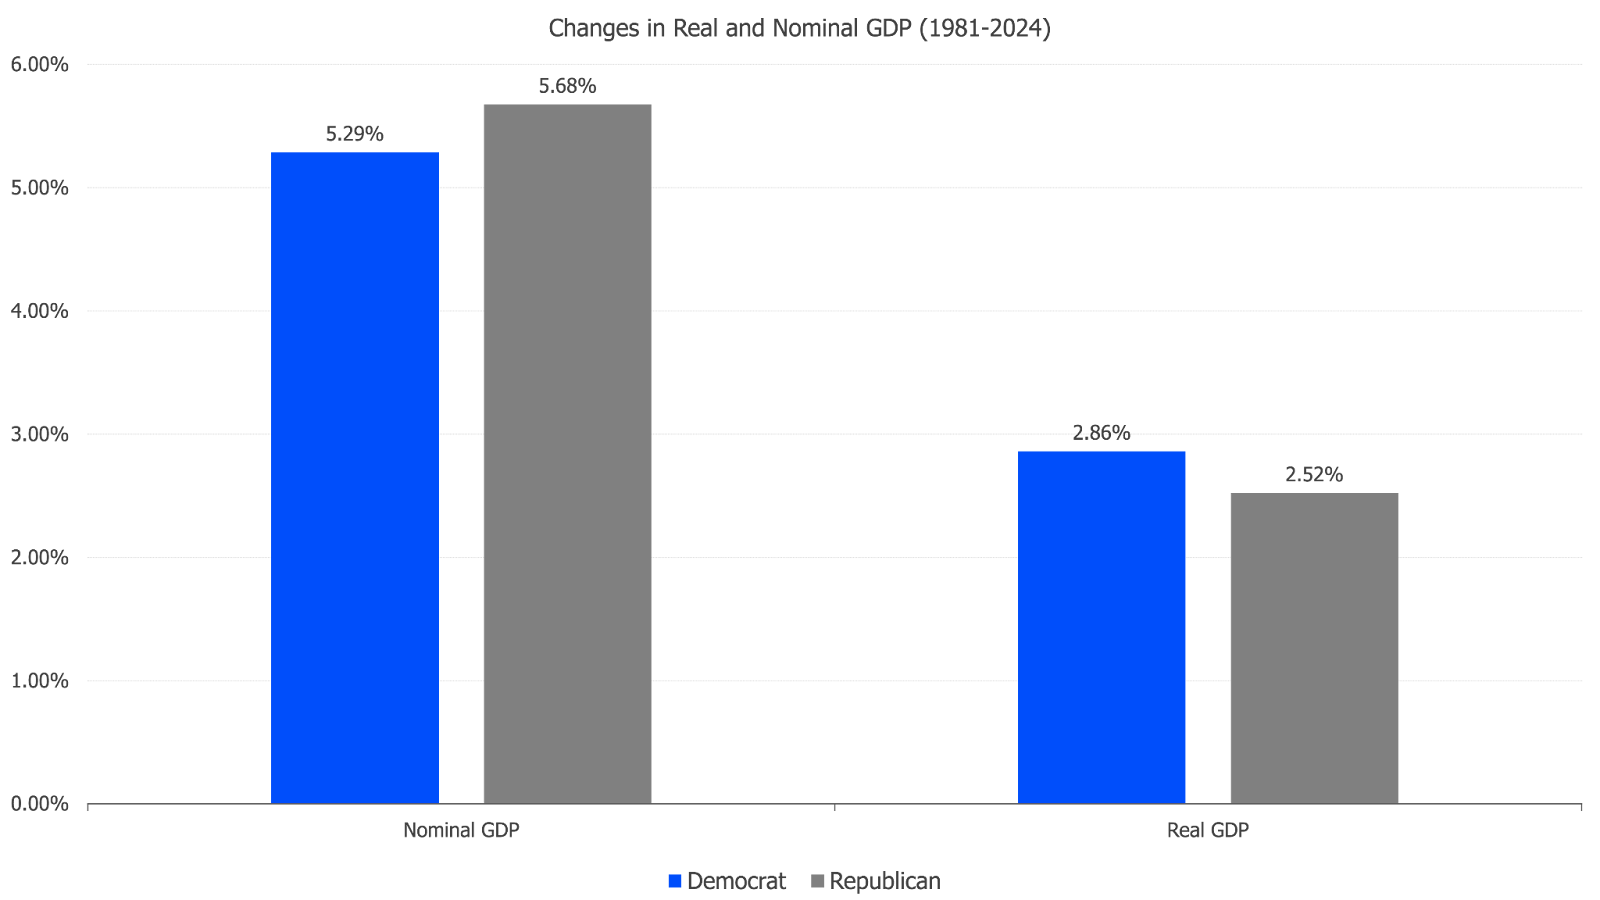
On the macroeconomic front, there’s an ongoing debate about whether Democratic or Republican administrations have overseen stronger GDP growth. Earlier research, such as the study by Blinder and Watson1, calculated that from World War II to 2013, U.S. real GDP growth averaged 4.3% under Democratic presidential leadership compared to 2.5% under Republicans. However, our analysis of data since 1980 (see Exhibit 5) shows that while Democratic administrations have still experienced slightly higher growth, the gap has narrowed, with real GDP growth being about 35 basis points higher on average under Democratic leadership. Moreover, nominal GDP growth under Republican administrations has been higher, reflecting their policy preferences that have been more inflationary.
Exhibit 5: Average Real and Nominal GDP Growth, 1981–2024
Source: Data provided by FTSE Russell/LSEG as of August 31, 2024. Past performance does not guarantee future results.
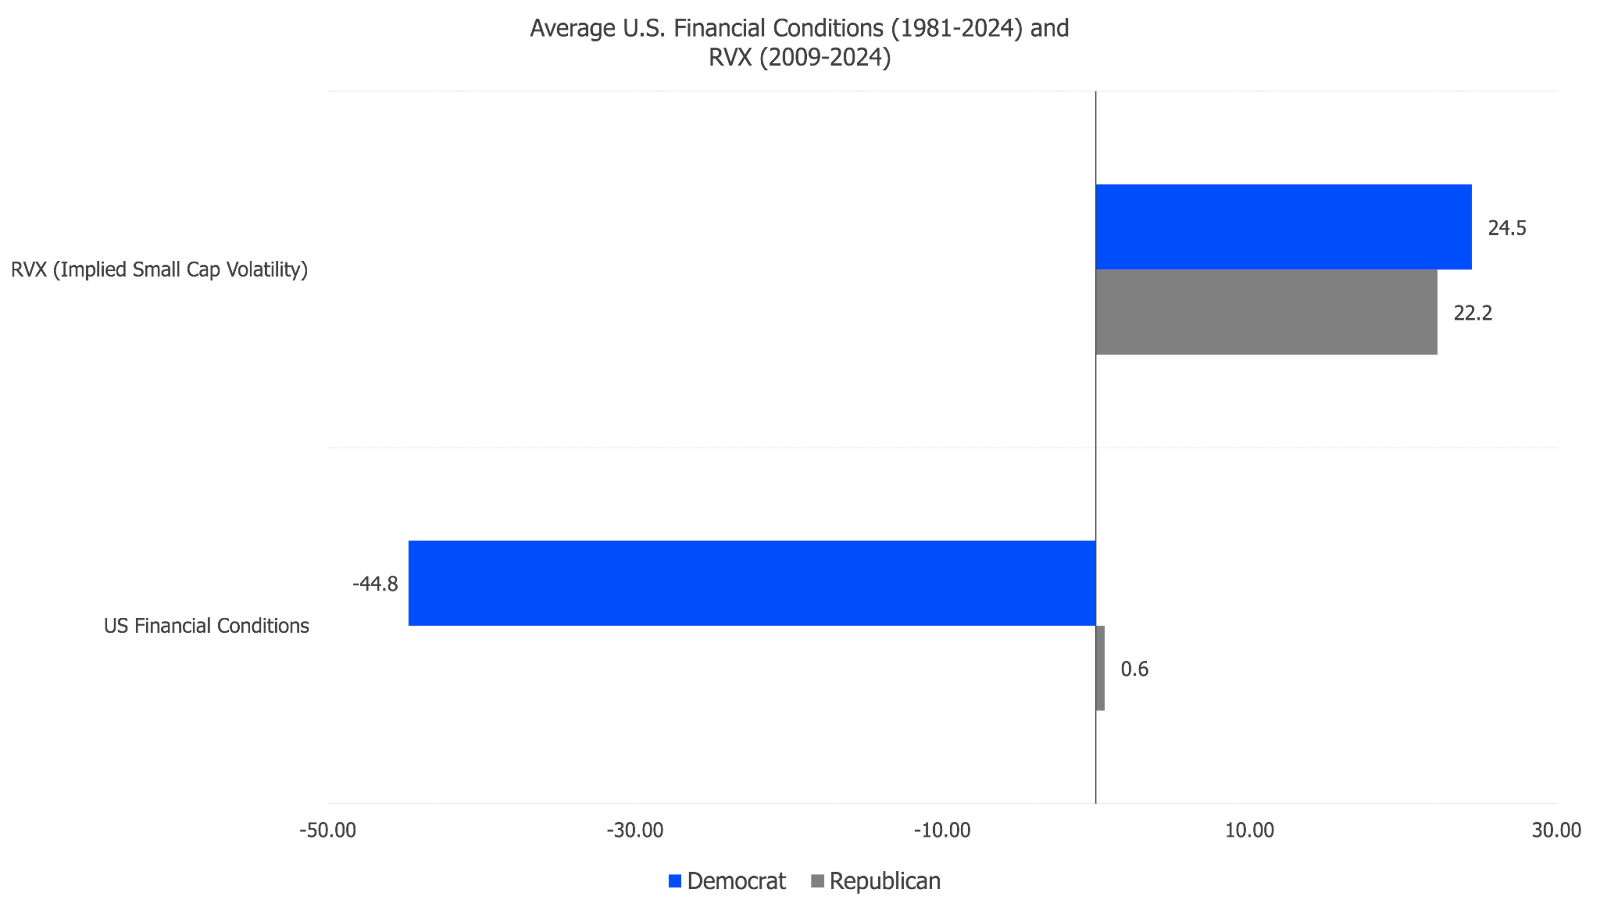
Furthermore, financial conditions have varied across different presidential administrations (refer to Exhibit 6). The Chicago Fed Financial Conditions Index indicates that, on average, financial conditions have been looser under Democratic administrations compared to Republican ones. Looser conditions typically reflect a more accommodative environment for borrowing and investment. However, when examining market volatility, the RVX Index—which measures implied volatility in the equity market—has generally been higher during Democratic administrations than during Republican ones. This suggests that while financial conditions may have been more supportive under Democratic leadership, market participants have nonetheless priced in higher uncertainty during these periods.
Exhibit 6: Average U.S. Financial Conditions (1981–2024) and RVX Index (2009–2024)
Source: Data from FTSE Russell/LSEG as of August 31, 2024. Past performance does not guarantee future results.
In summary, U.S. elections have a significant impact on both domestic and global markets, influencing investor sentiment and shaping policy expectations. This impact is typically reflected in higher implied market volatility during the months leading up to an election, followed by a decrease in volatility immediately afterward. Aligning with this pattern of uncertainty and volatility surrounding presidential elections, the average three-month return after an election has been higher than the three-month return preceding it. The first year of a new presidency often sees a boost in returns as political uncertainty subsides and markets anticipate new economic policies. On average, this initial year has been the most favorable for U.S. equity markets within a four-year presidential term. These effects result from increased election-related uncertainty affecting market volatility and returns, regardless of which candidate wins.
We have also observed variations in index performance and GDP growth during Democratic and Republican administrations, influenced by a range of economic and market factors. Differences in policies between the two parties—spanning from trade agreements to foreign relations—highlight the diverse market conditions investors must navigate. Additionally, monetary policies and global events, which operate independently of U.S. presidential elections, often play a more substantial role in shaping market outcomes than the presidency itself, underscoring the complex interplay between politics and economic performance.
However, the data demonstrates that, on average, returns have been positive after elections under both types of administrations. This indicates the potential benefits for investors who remain invested throughout periods of market volatility associated with elections. As we look ahead to future elections, investors should be mindful of these historical trends while also considering the current macroeconomic and geopolitical landscape.
Disclaimer: This article is for informational purposes only and should not be considered financial advice. Please consult with us or with any qualified financial advisor before making any investment decisions.